Unlock the Power of PyMOL: Elevate Your Protein Visualizations with Expert Tips and Tricks
Written by Keaun Amani | Published 2023-5-17
Written by Keaun Amani | Published 2023-5-17
Discover the secrets to producing breathtaking protein figures with PyMOL, the industry-leading software for molecular visualization. In this intermediate-level blog, we delve into a treasure trove of invaluable tips and tricks that will take your scientific visualizations to new heights. Learn how to leverage PyMOL's advanced features to create stunning, publication-ready images, enhance structural clarity, and captivate your audience with quality 3D models. Whether you're a seasoned researcher or a budding scientist, this blog is your essential guide to mastering PyMOL and transforming your protein figures into visual masterpieces.
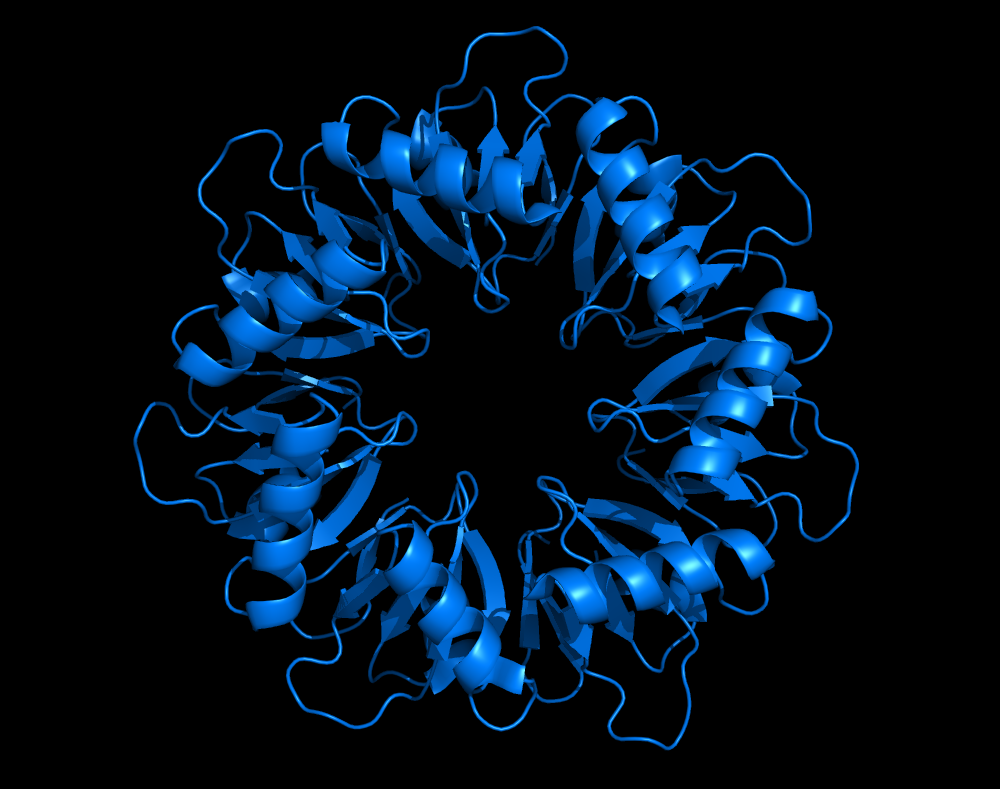
PyMol offers a number of different ways we can visualize our proteins and molecules. The most important ones that we're going to cover consist of cartoon representation, backbone, backbone + side chain, and surface.
The most commonly used 3D representation of proteins and complexes probably consists of the cartoon models. The cartoon visualization is often used because it provides a very straightforward, yet comprehensive view of protein structures. Additionally, cartoon models are an intuitive way to show protein secondary structures like beta sheets and alpha helices. This is also the default visualization on PyMol.
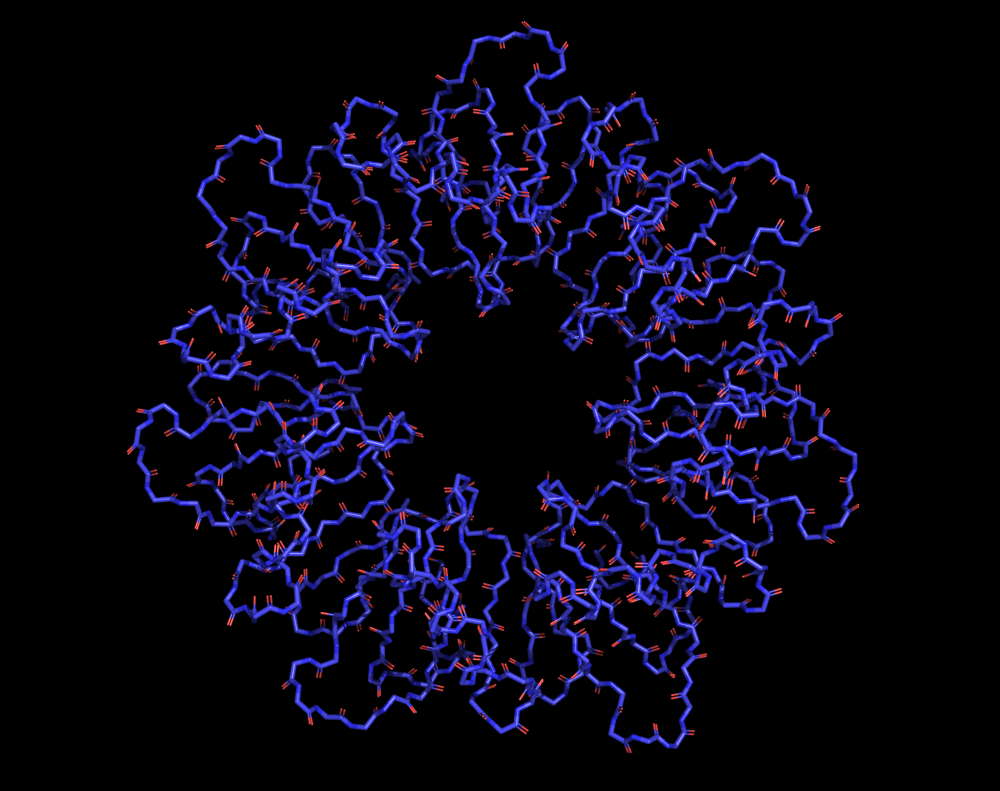
The backbone only visualization is basically a minimalist representation only consisting of atoms found within the protein's backbone.
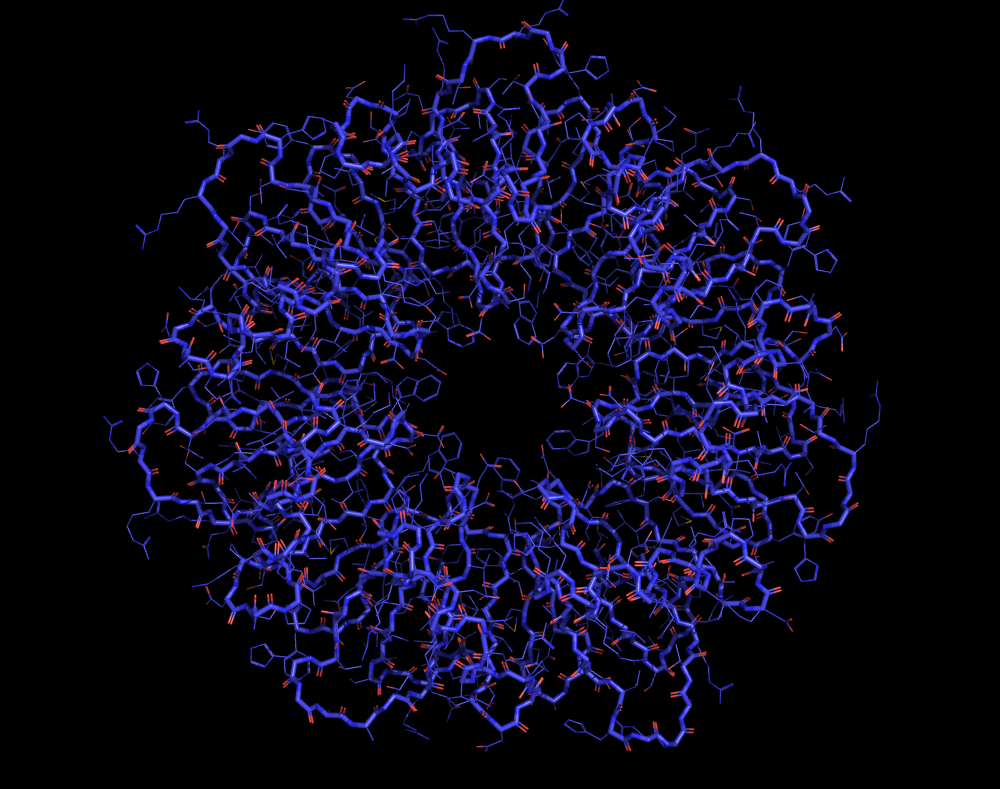
The backbone + side chain visualization on the other hand is a very detailed visualization that effectively shows you all the atoms found within the protein.
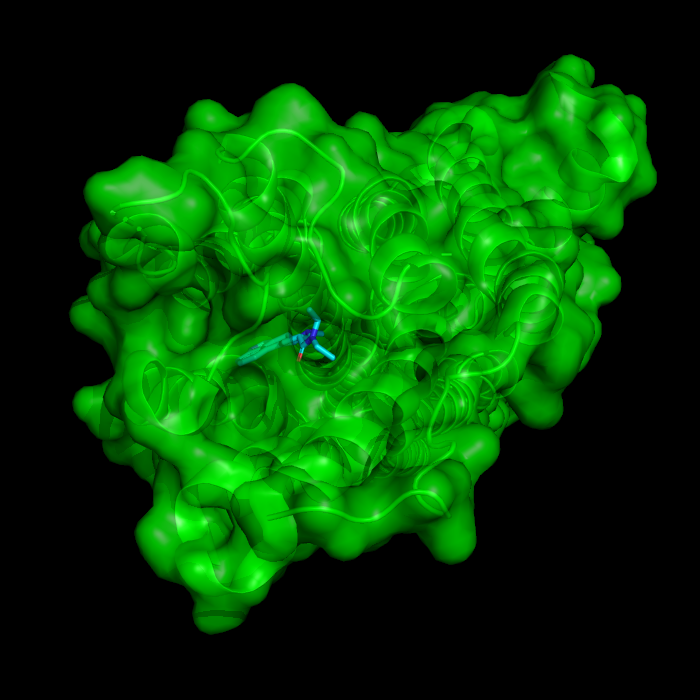
The surface visualization is the surface that would be traced out by the surfaces of waters in contact with the protein at all possible positions.
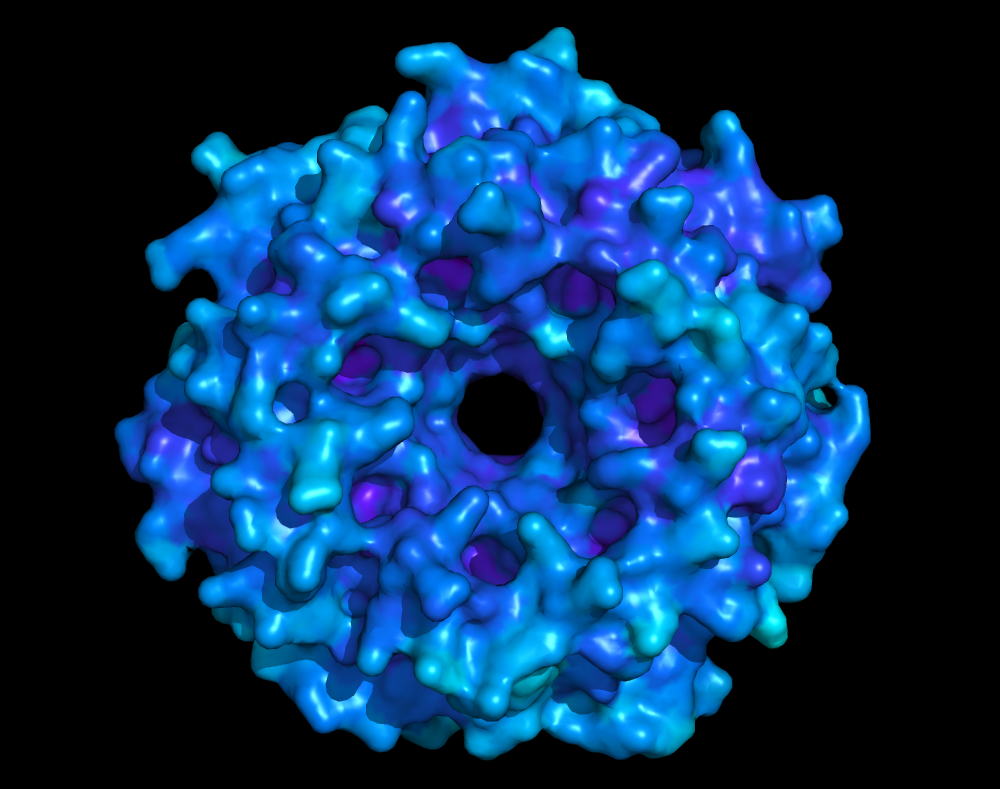
Another noteworthy thing to mention about surfaces is that you can easily set their opacity and combine them with other visualizations like cartoon or backbone.
To set transparency use the following:
Command: set transparency, [opacity], [protein_object_name]
Example: set transparency, 0.75, 5tvn
The B factor field (or sometimes called temperature factor field) of pdb and mmcif files can be thought of as additional per residue metric or metadata that in many cases can provide us with useful insight into the potential inaccuracies of a given structure. For experimental structures, it provides insight into the mobility and flexibility of atoms in a macromolecular structure, reflecting the thermal vibrations associated with those atoms.
Traditionally, the B-factor field represents the temperature factor or the thermal vibration factor for each atom in a protein or other macromolecule structure. The B-factor provides information about the mobility or flexibility of the atoms in the structure.
The B-factor value is a measure of the displacement or motion of an atom from its average position due to thermal fluctuations. It indicates the uncertainty or "blur" associated with the atom's position. Higher B-factor values generally correspond to higher atomic mobility or flexibility, while lower B-factor values indicate more restricted or well-defined atomic positions.
The B-factor is typically reported in units of square angstroms (Å^2) and can be determined experimentally using techniques like X-ray crystallography or nuclear magnetic resonance (NMR) spectroscopy. In crystallography, B-factors can be refined during the structure determination process, while in NMR, they can be estimated from the experimental data.
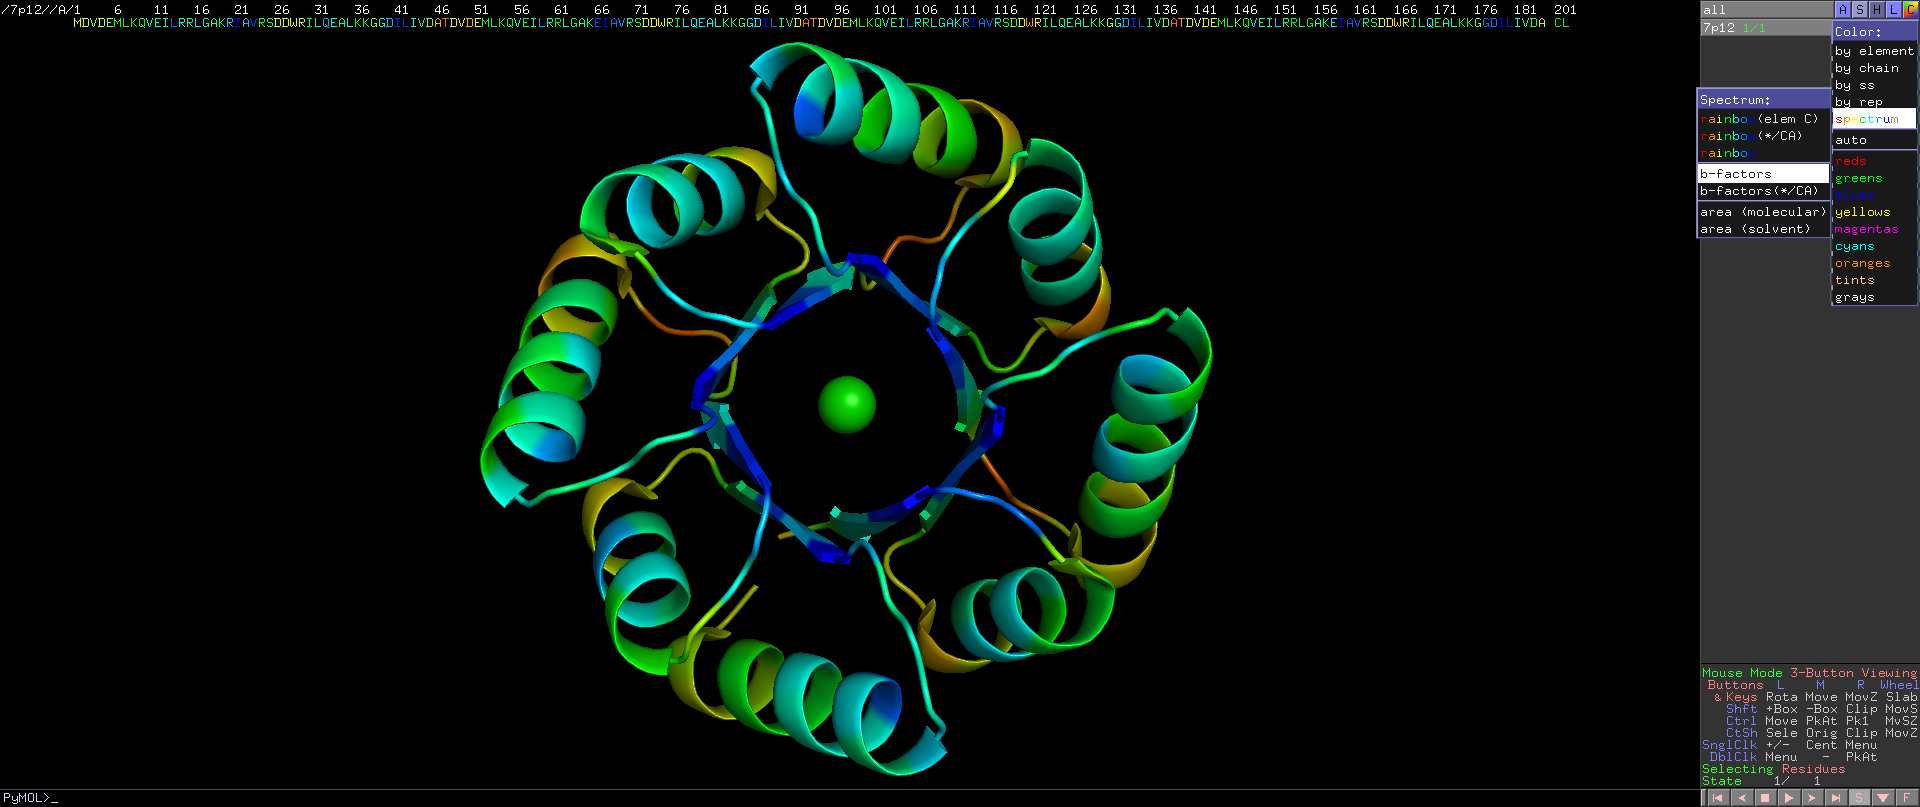
AlphaFold2 predicted structures also have B-factor field, except these values correspond to each residue's pLDDT value where higher is better. To color your AlphaFold2 structures by pLDDT just type the following command in PyMol:
Command: spectrum b, tv_red_yellow_green_cyan_marine, minimum=50, maximum=90
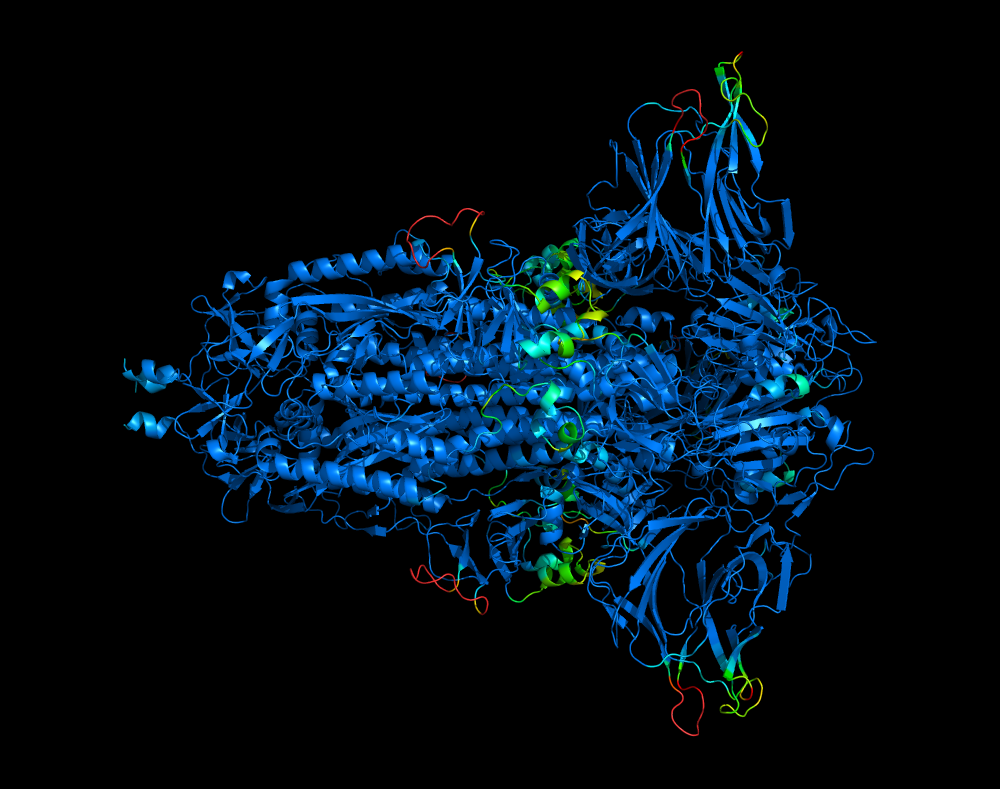
For more information on pLDDT and other AlphaFold2 metrics check out our blog post on the topic here.
RoseTTAFold also populates the B-factor field using it's own version of pLDDT. To color your RoseTTAFold structures by pLDDT just type the following command in PyMol:
Command: spectrum b, tv_red_yellow_green_cyan_marine, minimum=0.5, maximum=0.9
Some other cool options for spectrum include coloring by chain, by atom count, and even more! For a full list options visit PyMol wiki here.
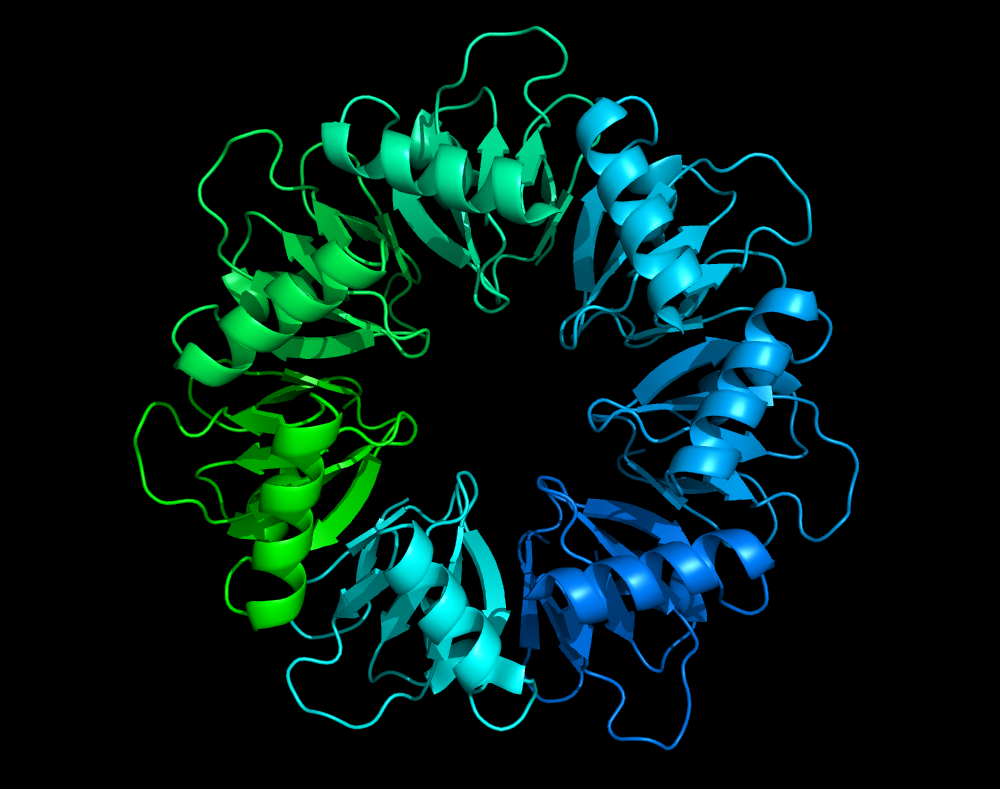
spectrum chain, green_cyan_marine. In this case the color of the chain is interpolated using the colors defined in the command.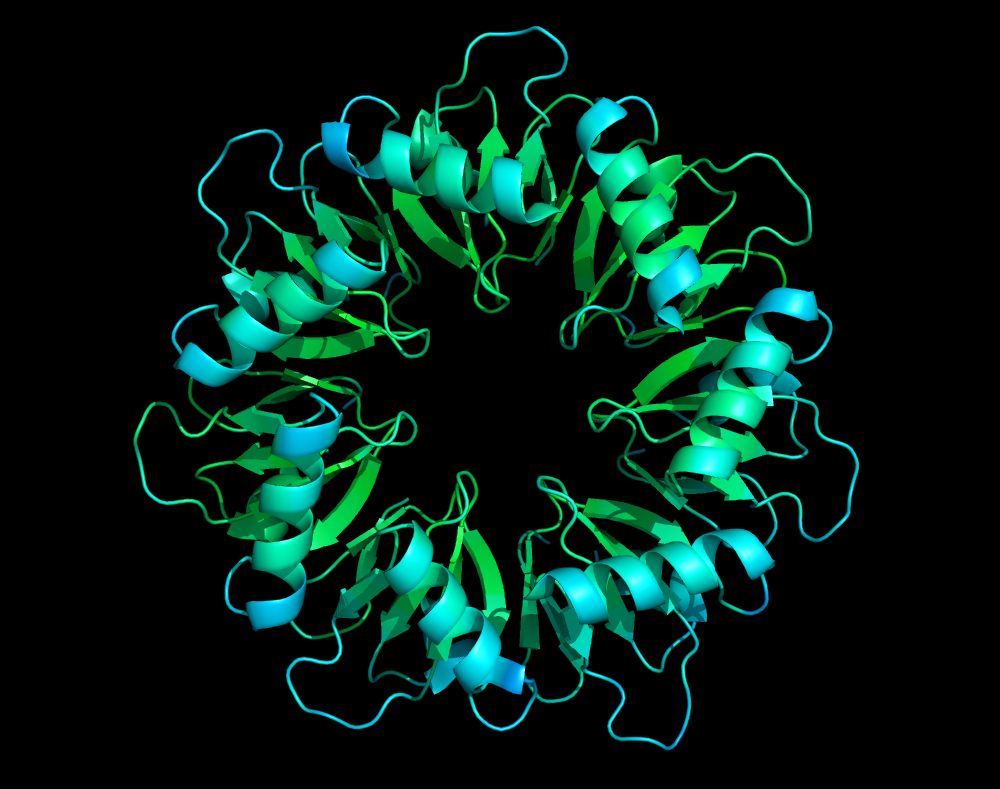
spectrum b, green_cyan_marine. In this case the color of the residues are interpolated using the colors defined in the B-factor field, creating a striking visual effect.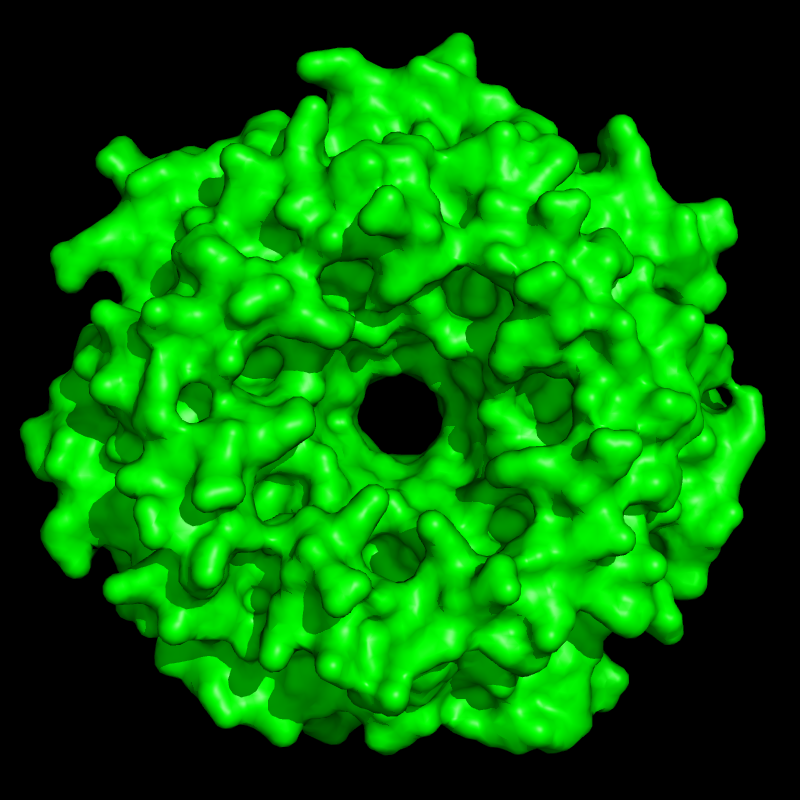
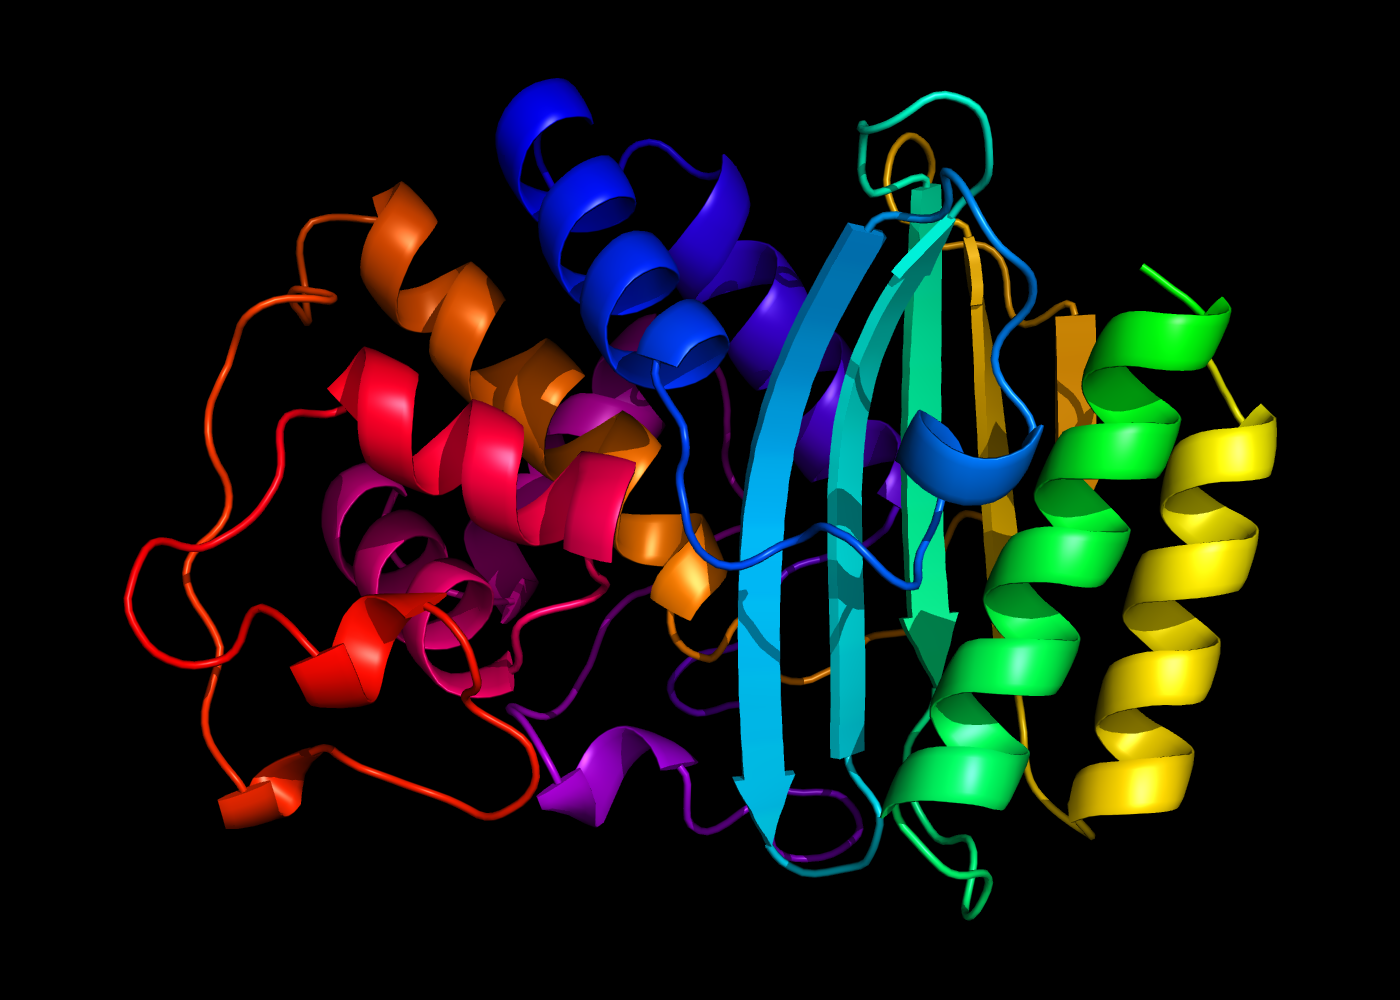
spectrum resv, yellow_orange_red_magenta_blue_cyan_green.If you have a complex or multimer you can actually display all the side chains with 5 angstroms of the ligand molecule.
Command: show sticks, byres all within 5 of [ligand_object]
Example: show sticks, byres all within 5 of ligand
Note that we choose 5 angstroms for our cutoff since hydrogen bonds are measured from the center of one atom to the center of another (nuclei to nuclei). If you measure that in angstroms, the distance of a hydrogen bond is usually 2.8 to 3.4 angstroms. Ionic interactions can be a bit shorter and london forces or vanderwhalls interactions between non-polar chains are usually within the 3.8 to 4.2 range. This is why the above 5 angstroms is chosen.
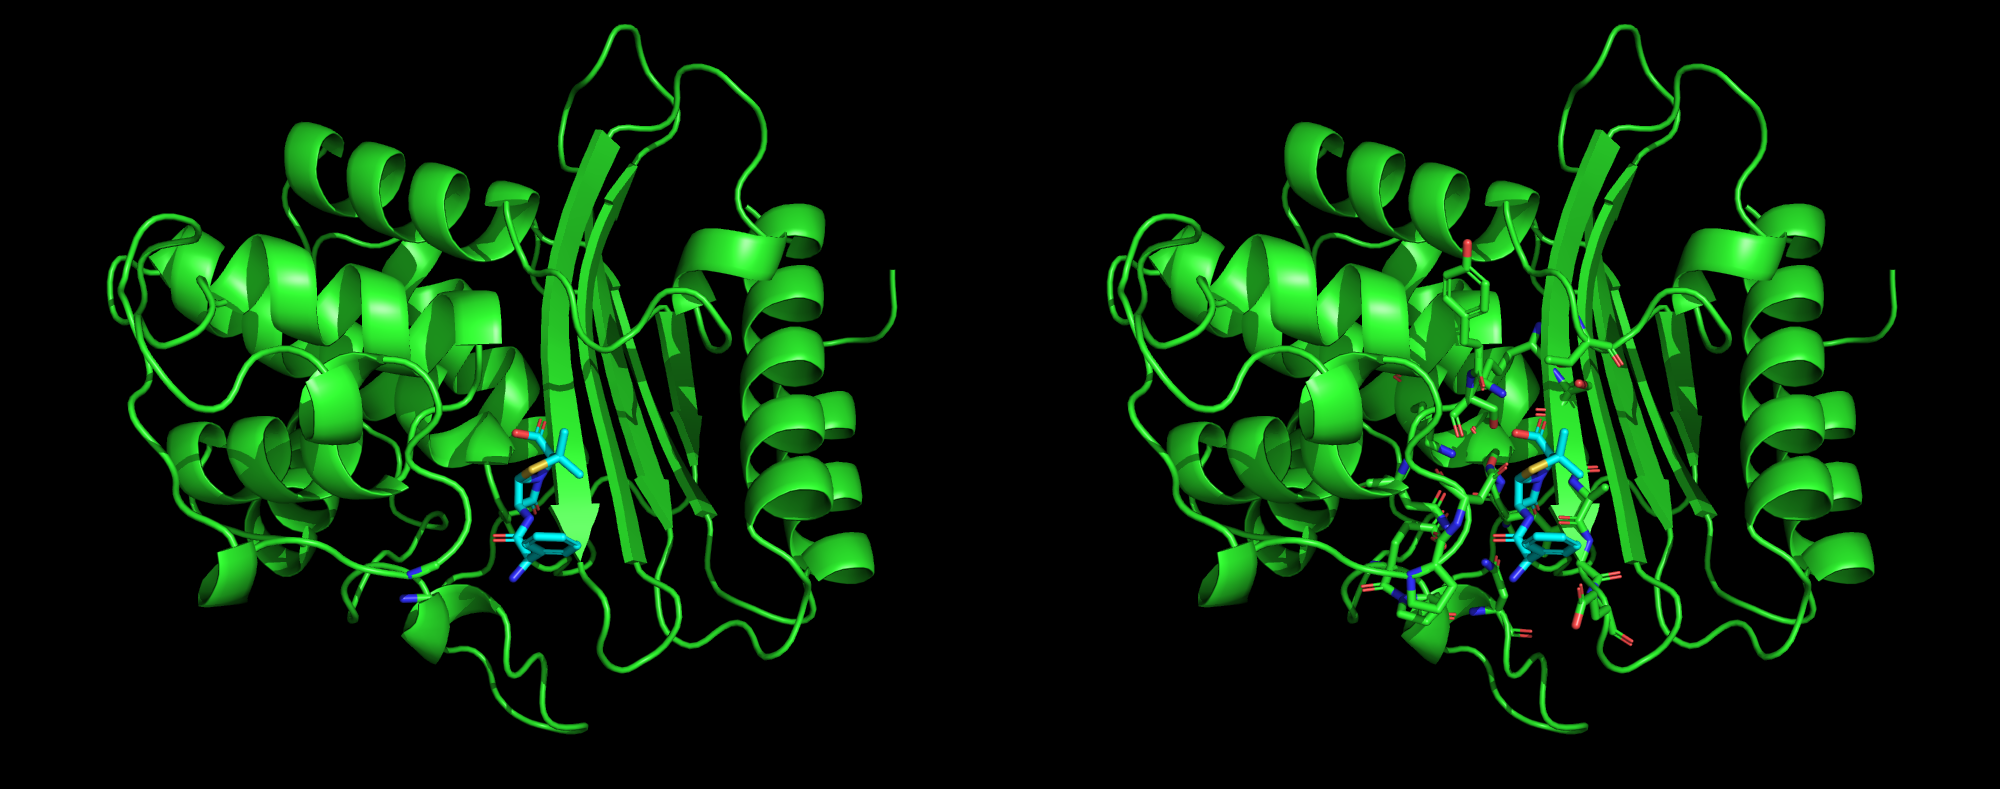
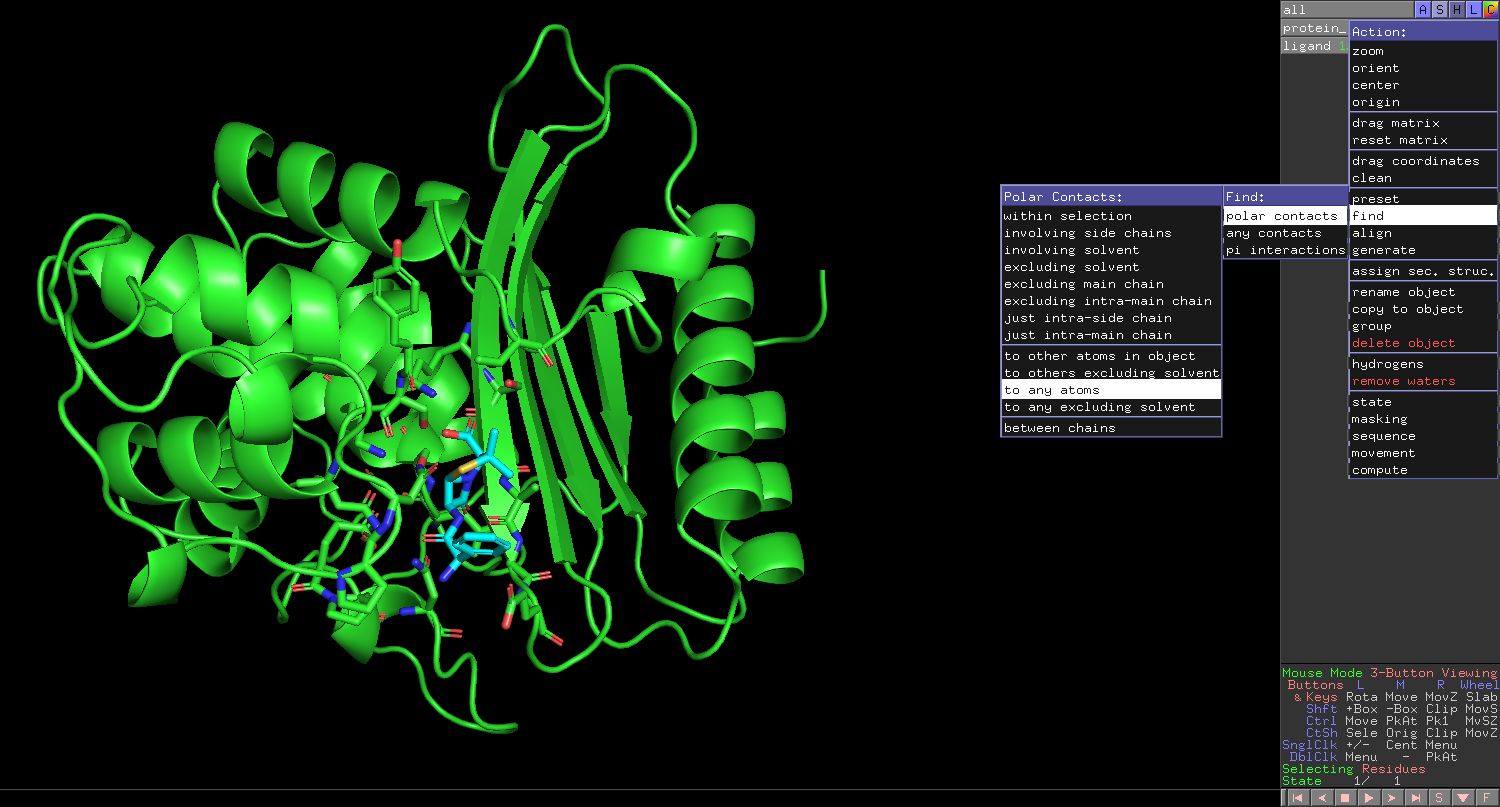
Another very useful technique is to display all the polar interactions / hydrogen bonds.

In conclusion, PyMOL proves to be an indispensable tool for scientists looking to create visually striking and informative protein figures. By utilizing the tips and tricks we've explored in this blog, you can unlock the full potential of PyMOL and elevate your scientific visualizations to a whole new level. From manipulating molecular structures to applying advanced rendering techniques, you now possess the knowledge to produce stunning, publication-worthy images that effectively communicate your research findings.
So, go ahead and embrace the power of PyMOL, experiment with its vast array of features, and let your protein figures tell compelling stories that captivate audiences and push the boundaries of scientific visualization. With practice, dedication, and these expert insights, you're well on your way to becoming a PyMOL virtuoso and making a lasting impact in the world of molecular biology.
If your thirst for neat PyMol tricks hasn't been satisfied, check out this collection of some of the most unique tricks you can do with PyMol.
By Danial Gharaie Amirabadi
By Keaun Amani
By Amélie Lagacé-O'Connor
By Keaun Amani
By Amélie Lagacé-O'Connor
By Amélie Lagacé-O'Connor
Register for free — upgrade anytime.
Interested in getting a license? Contact Sales.
Sign up free