How to Use AlphaFold2 as a Wet Lab Biologist (Pt 3)
Written by Keaun Amani | Published 2023-3-27
Written by Keaun Amani | Published 2023-3-27
In our previous post, we discussed AlphaFold2 and provided a detailed guide on using it effectively. We covered its various settings, explained their meanings, and shared insider tips and tricks to help you generate more accurate protein structure predictions. In this post, we'll go a step further and focus on how to interpret AlphaFold2 results. We'll guide you through the process, explain the different metrics provided by the model, and introduce you to Neurosnap, our platform that simplifies the entire process.
Our AlphaFold2 implementation predicts five structures for each input sequence; these predictions are then ranked by their pLDDT or another configurable metric.
The pLDDT is a per residue confidence metric that allows us to infer the accuracy of each predicted residue's spatial orientation and position. Values range between 0 and 100, where higher values confer greater confidence in the predicted residue's position.
A high overall pLDDT means AlphaFold2 is confident in its prediction, whereas a low mean pLDDT means that AlphaFold2 is not very confident in the predicted structure. Furthermore, high values in some areas of a protein could mean that AlphaFold2 is confident about the positions of those residues but not the rest of the structure.
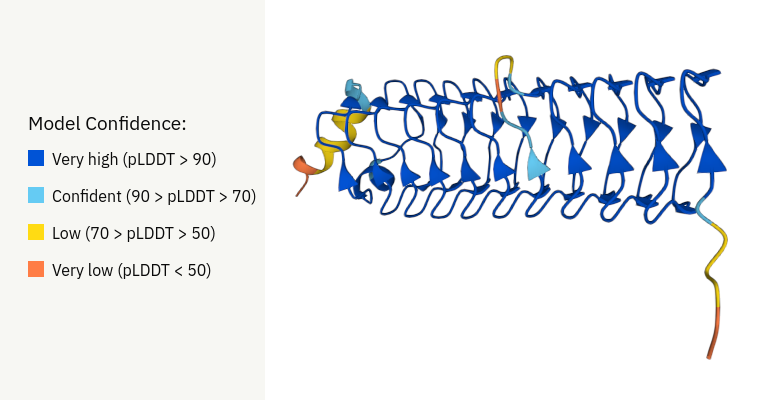
Another fascinating property of pLDDT values is that they also confer nicely with intrinsically disordered regions as well as other regions that might be inherently disordered. For example, within most protein families, you'll notice that the C and N termini tend to be variable and poorly conserved. This is usually due to the amino acids within those positions not being critical to the overall conformation of the protein, hence the variability and generally lower pLDDT scores within residues at those positions.
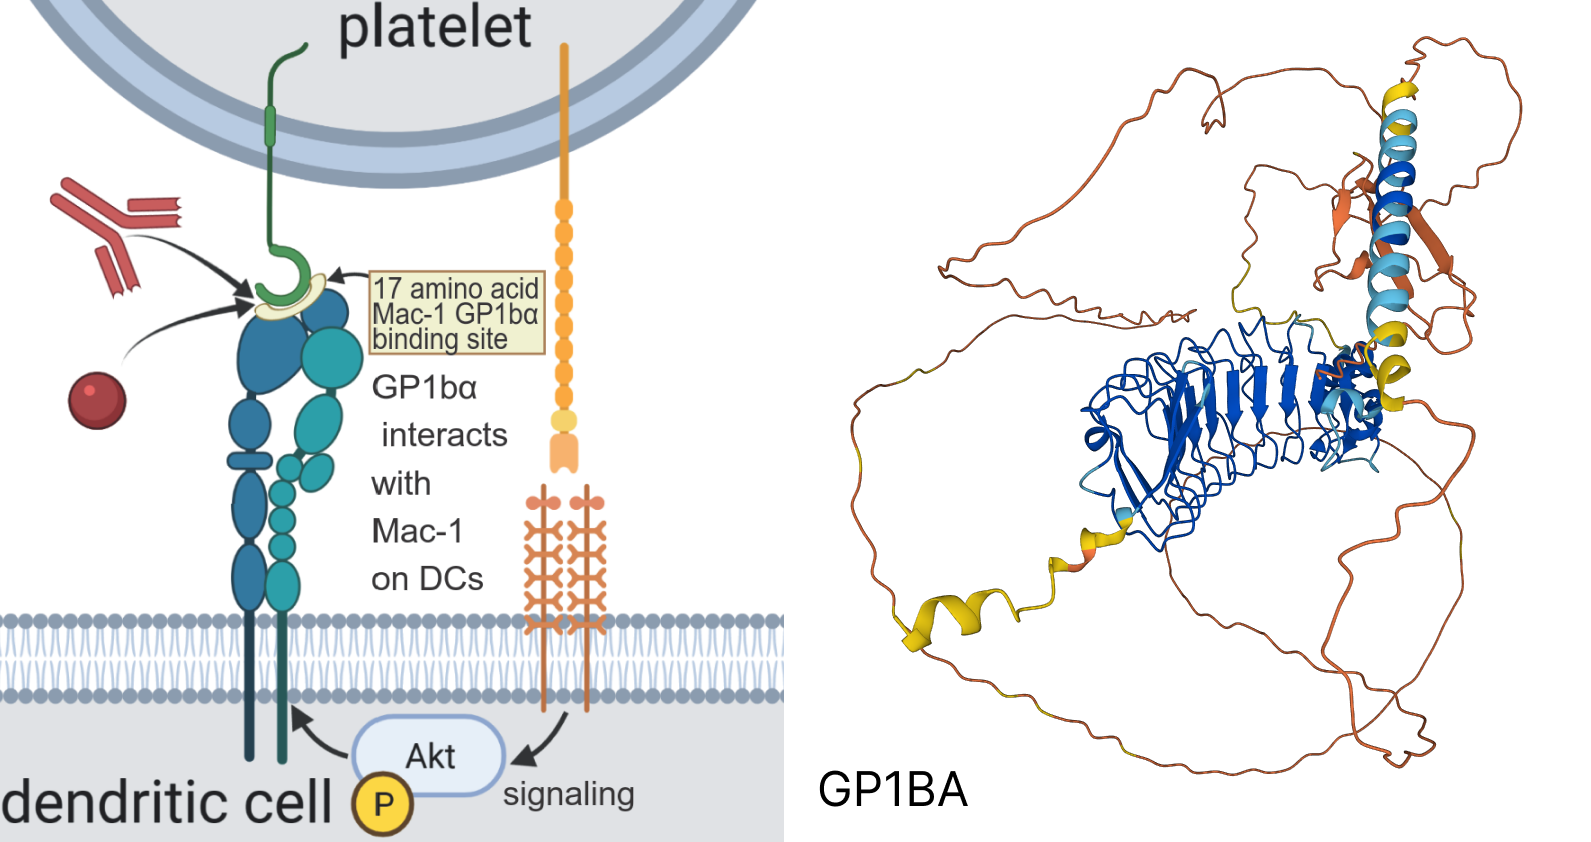
Funny enough, this can also be applied towards identifying intrinsically disordered regions such as those found within trans-membrane containing proteins such as the one below.
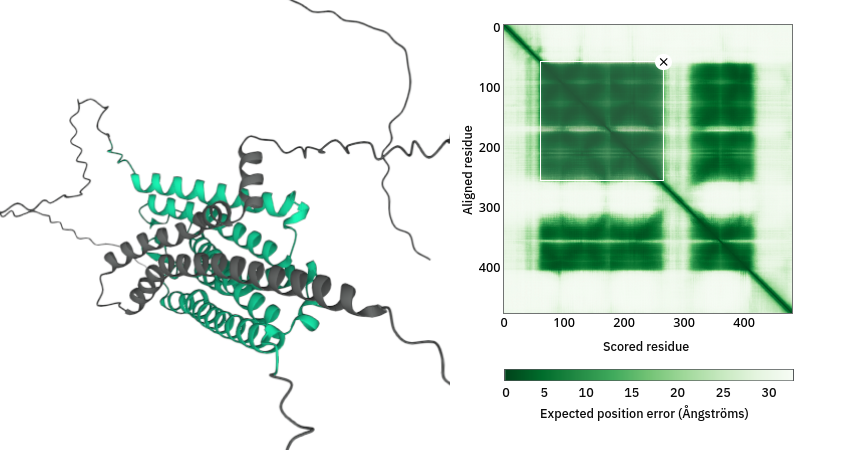
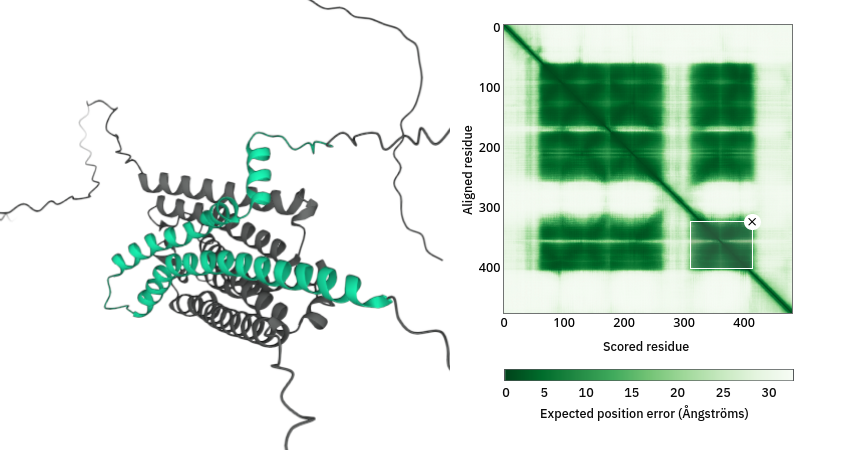
The PAE is a 2D heatmap representing the expected positional error or variance in angstroms at some residue x when the predicted and true structures are aligned on residue y. PAE values range between 0 and 30 per position, where 0 means the model is very confident in the residue-residue interactions, and 30 means incredibly low confidence in the residue-residue interactions. The PAE chart can also be handy for identifying different domains within proteins.
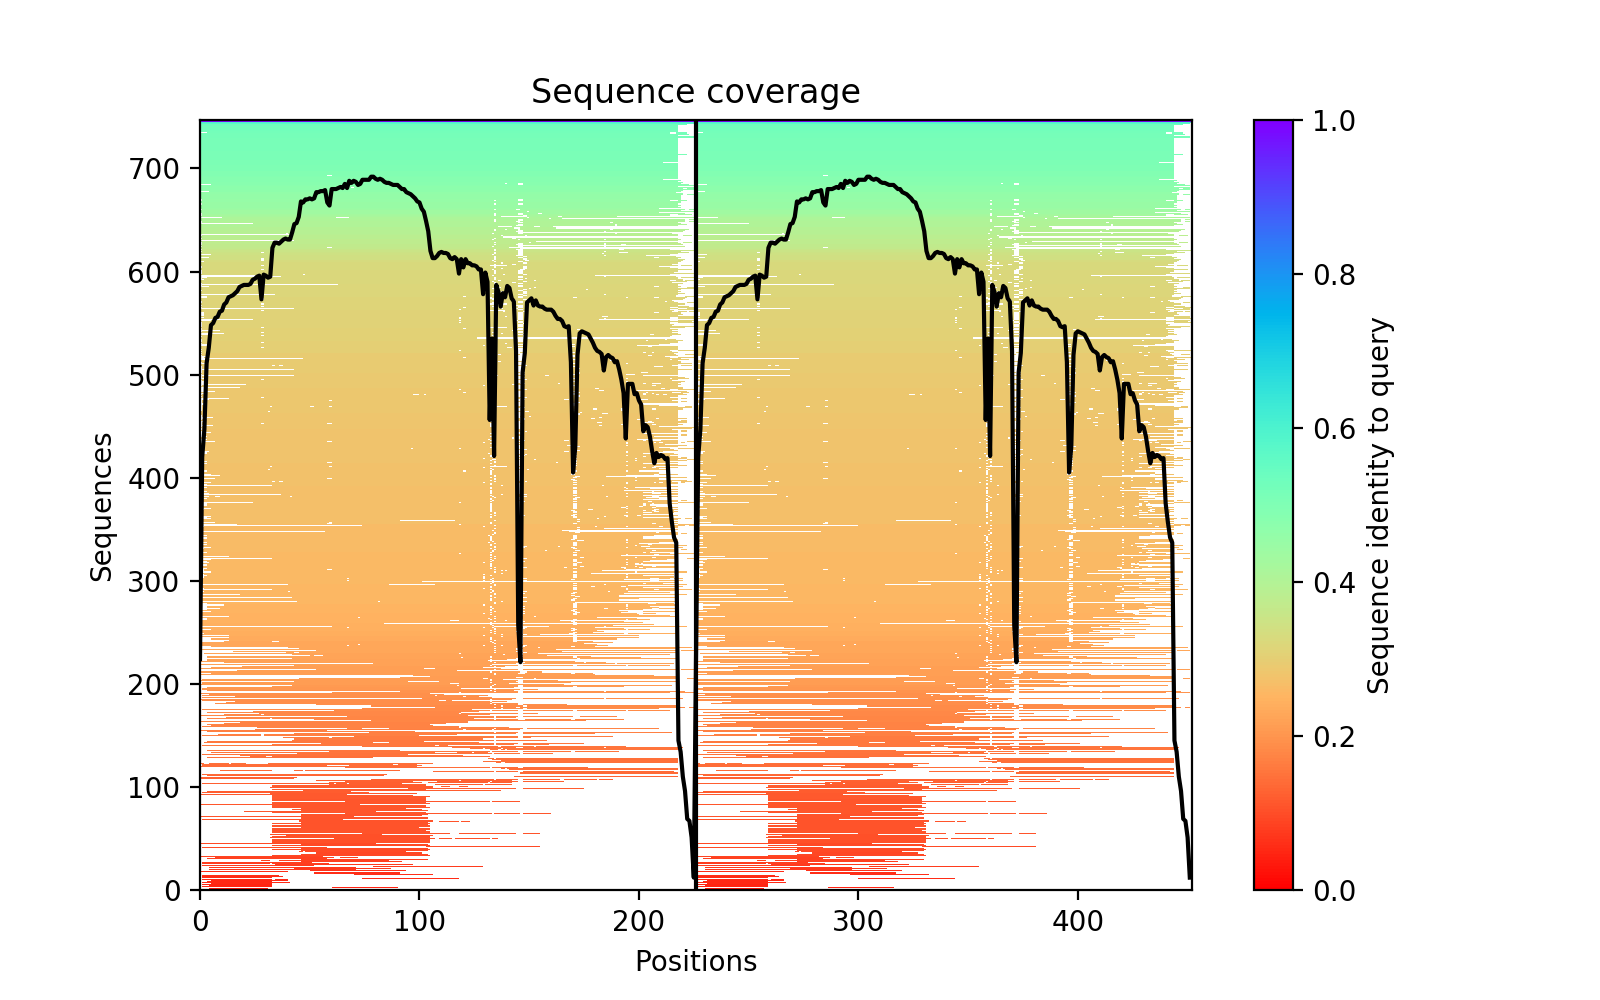
The MSA sequence coverage is a chart representing the number of aligned sequences at each position for the input MSA. Each bar in the plot represents a sequence within the MSA; sequences that are most similar are bluer and closer to the top. Note that only parts of the sequence that align are shown; shorter lines do not correspond to shorter proteins. The black line represents the number of matches to the query at a given residue.
The pTM score is just the predicted TM score between what AlphaFold2 predicted and the true structure. Higher pTM values tend to be better predictions; pTM values can range between 0 and 1. In most cases, anything with a pTM score greater than 0.75 can be interpreted as a reasonable prediction. It's also worth mentioning that the pTM score is computed directly from the PAE matrix.
The ipTM score is an additional metric that is only present for multimers/complexes. The ipTM score is essentially the computed pTM score between the interfaces of the different chains. Values for the ipTM score also range between 0 and 1 with higher values usually meaning more accurate predictions. Additionally, ipTM scores above 0.75 can also be considered reasonably high quality .
While AlphaFold2 is pretty impressive, it still has some drawbacks that we must be aware of.
AlphaFold2 can sometimes struggle with predicting the structures of very large proteins and complexes (usually those that exceed 1,400 amino acids). This is primarily because longer inputs require quadratically more resources and time to predict. In most cases, memory runs out, causing AlphaFold2 to fail, which is one of the reasons why many people struggle with running AlphaFold2 locally. However, with Neurosnap you can easily predict proteins and complexes beyond 3,000 amino acids.
One of the reasons why AlphaFold2 works so well is because it was trained to take in an MSA that it can extract evolutionary information from, such as covariance for certain positions. Orphaned proteins are proteins with no close homologs and therefore can't have meaningful MSAs generated for them. Because AlphaFold2 won't have access to evolutionary information when predicting these types of proteins, it's no surprise that the accuracy will also decrease.
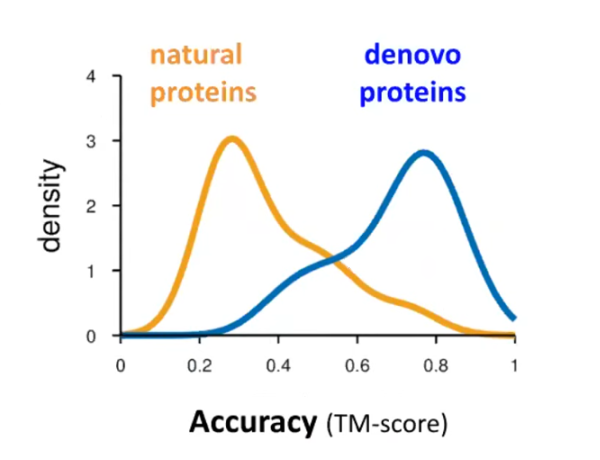
AlphaFold2 can sometimes struggle with de novo proteins. An interesting workaround for this is to enable the single-sequence MSA option, which has been demonstrated to increase accuracy for de novo proteins but is overall less accurate for natural proteins. Despite this contradicting the above section about orphaned proteins, it works reasonably well. The same also applies to roseTTAFold.
AlphaFold2 sucks at predicting most mutations; it is highly inadvisable to use AlphaFold2 alone to screen for mutants as it will likely overlook critical mutations and give you structures that "look good" but won't fold.
Suppose you’re trying to model a complex and know which residues are responsible for interfacing with the other proteins. In that case, you can isolate the AA sequences corresponding to the interfaces, predict those, and then align the structures using something like pymol on the predicted interfaces.
Another trick for dealing with large proteins is to partition the protein into distinct segments with overlapping regions and then predict the structures of each partition. The overlapping regions can then be joined to effectively "link" the structure together.
Finally, even though AlphaFold2 can sometimes struggle with mutants and orphan sequences. In both cases, it rarely hurts to run AlphaFold2 anyways, as it still yields valuable information that can be used downstream.
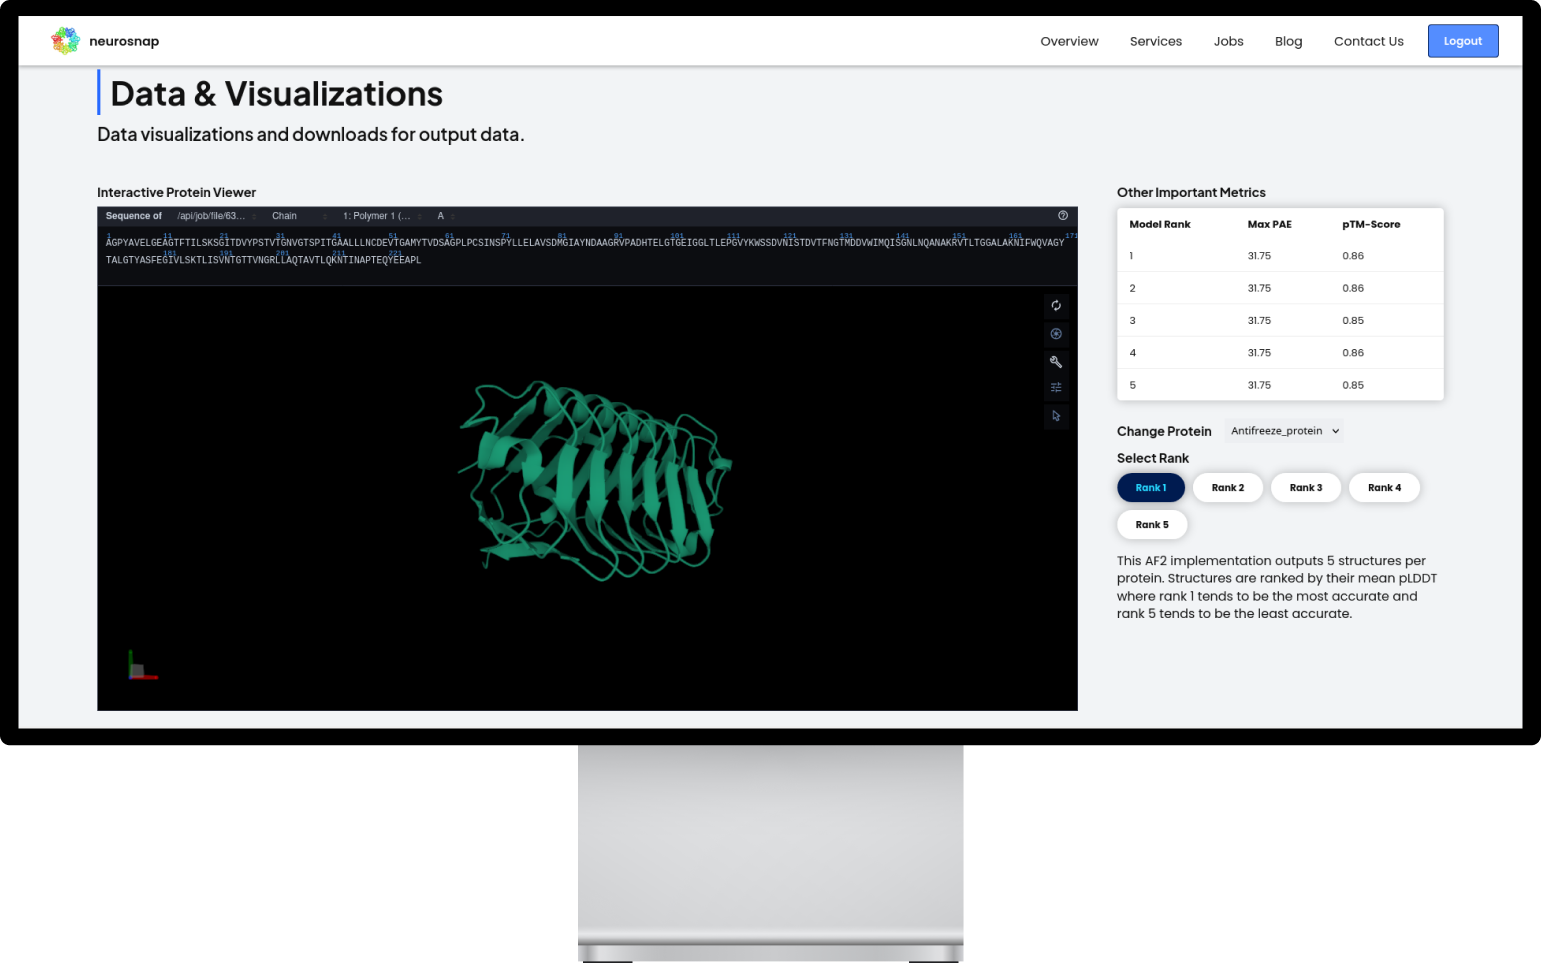
Check out this live demo of an AlphaFold2 job that we ran directly on our platform! No registration or anything required. To submit your own AlphaFold2 job visit this page.
By Keaun Amani
By Keaun Amani
By Danial Gharaie Amirabadi
By Keaun Amani
By Keaun Amani
By Amélie Lagacé-O'Connor
Register for free — upgrade anytime.
Interested in getting a license? Contact Sales.
Sign up free